
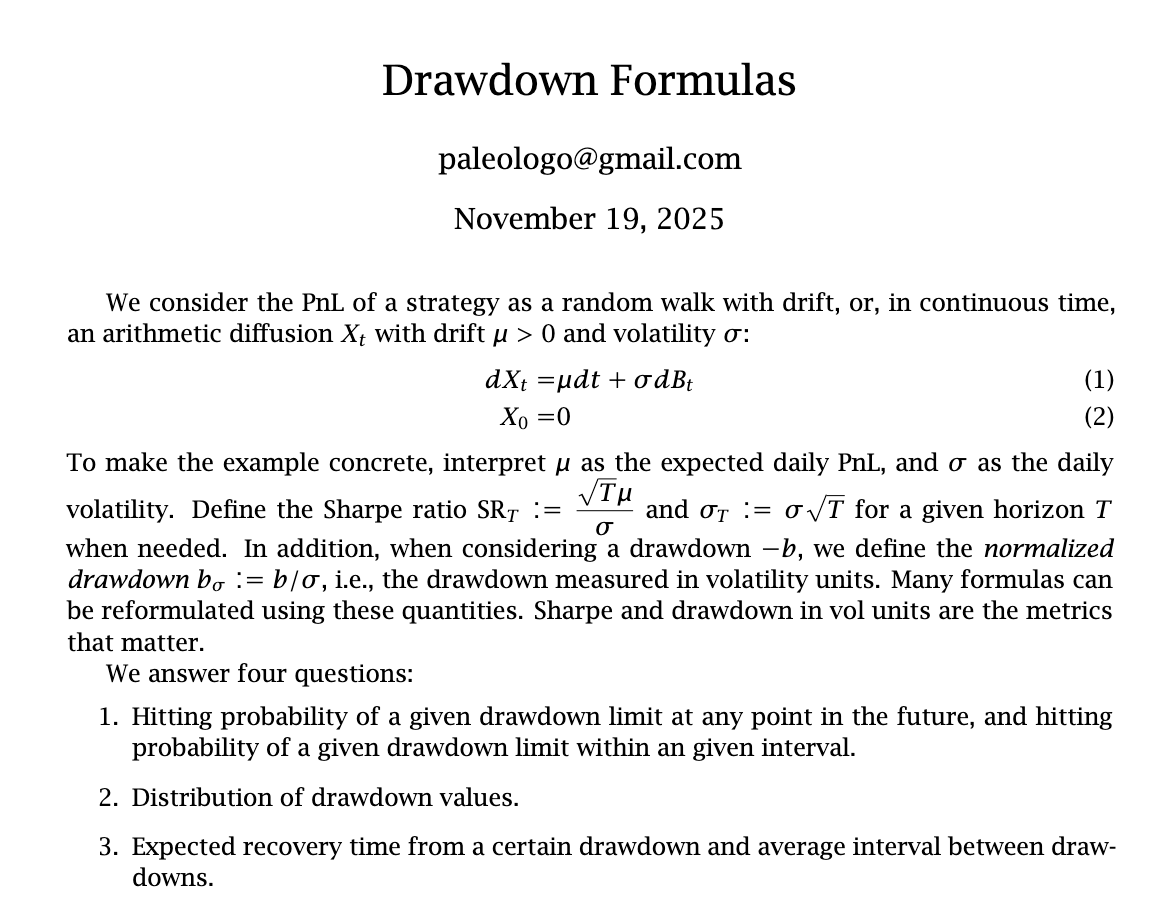
Reading, Writing and Drawdown Arithmetic
We were born to suffer

A portfolio manager receives a volatility budget of $40m and is told that he has a limit of $30m to lose starting on January 1. Is it possible to estimate the probability that the strategy will hit the drawdown limit over the course of a year? What is the probability that the manager will hit the drawdown limit at all in the long run? What fraction of the time will the strategy be running while in a drawdown of $20m? And suppose the PM hits a drawdown limit of $40m: how long will it take, in expectation, to reach the high-water mark again?
These estimates help the investor (and the business leads managing him) build intuition about the (un)exceptional nature of drawdowns. This post should help. It is one of those things that take time to find or derive, and then we forget about them until we need them again—at which point we re-derive them, ad infinitum. Having a sense of drawdown frequencies and durations will not make anyone rich, but it may save them from the demon of overconfidence.
Since Substack is not especially well suited for technical documents, I have written a separate one in LaTex, that you can use for reference. Here, I will focus on the simple example above to introduce formulas.
Check out this document with detailed formulas!
Probability of a Drawdown Since Start of Trading.
The PM wants to know the probability of a cumulative loss since the start of trading. This is not the probability of a drawdown, which is a peak-to-trough measure.
Having a volatility budget and a maximum loss limit is not enough. The PM also needs to know the true Sharpe ratio. Suppose the PM has an annual Sharpe ratio of 1.25 (pretty good). It is useful to think not in terms of dollar losses, but in units of annualized volatility. So instead of losing $30m, the loss is $30m/$40m = 0.75 volatility units. We denote this normalized quantity by bσ. The probability of reaching the drawdown is
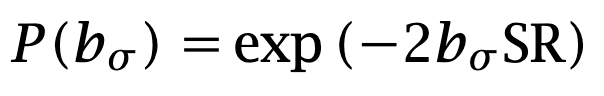
Substituting the values, you obtain 15.3%. Here is a table for several values of the normalized limits and Sharpe ratios:
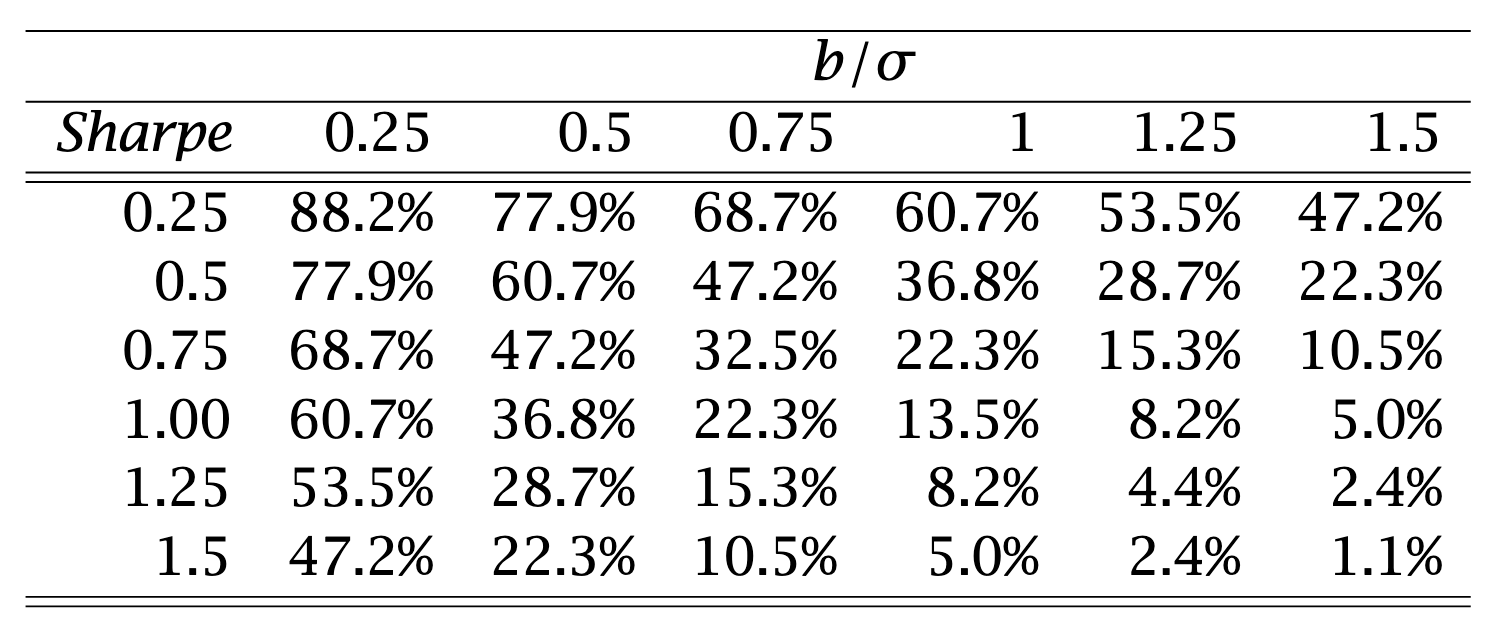
You can see that the probability decreases exponentially as either the Sharpe ratio increases or the drawdown limit increases.
Probability of a Drawdown Occurring within a Future Date
Maybe the PM does not care about the probability of a drawdown at some point in the distant future, but only within the current year. The formula is a bit more involved. One year has T = 251 trading days. We define SRT as the Sharpe Ratio adjusted to time horizon T. In practice, T = 1 corresponds to one year, and the Sharpe ratio is unchanged. If we care about six months, then T = 0.5 and SR= 1.25 x sqrt(0.5) =088. The formula becomes
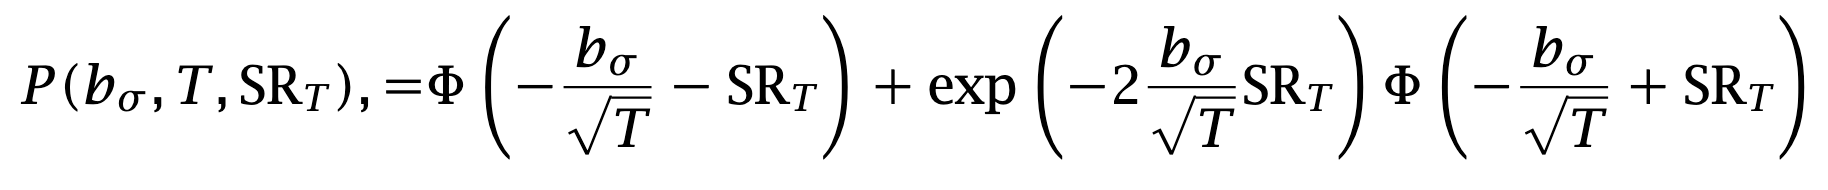
Here, Φ(x) s the cumulative distribution function of the standard normal distribution. This formula can be useful in special circumstances—for example, when T is much smaller. In our example, however, the probability is not very sensitive to the time horizon: the value remains 15.3%. The simpler formula works quite well.
Percentage of Time That the Strategy is Below a Certain Drawdown level
This metric is also useful. It tells us, for a given drawdown level, the percentage of days on which the PnL will be at that drawdown level or worse. There is an interesting result: the formula is exactly the same as the probability of hitting the drawdown since the beginning of the year.
We do not need to perform new calculations. If the limit is $30m, the PM will be under that limit about 15% of the time. That is quite a high probability. Two additional considerations qualify this result.
The first is that we assumed returns are normally distributed, which is unrealistic. If returns are heavy-tailed, the probability worsens because large losses are more likely. The second consideration works in the opposite direction. We assumed that the volatility of the strategy is kept constant, which is not the case in practice. A portfolio manager often reduces overall portfolio volatility during a drawdown through a number of measures.
First, during a loss, factor risk is often the first to be cut: the portfolio manager reduces exposure to sources of systematic risk. Second, the manager reduces overall risk. Sometimes the book is reduced pro rata; other times it is reduced in a way that minimizes execution costs. Finally, some large positions may be trimmed to make the portfolio more equal-sized and better diversified. For all of these reasons, portfolio volatility typically decreases as a function of drawdown, which in turn reduces the probability of further drawdowns.
The effects do not exactly cancel out, but the exponential formula still provides a reasonable approximation. I have written a simple simulator that you can use to quantify the importance of heavy tails. Returns are modeled as t-distributed with a given number of degrees of freedom. One hundred degrees of freedom are close to normal returns; five degrees of freedom, by contrast, are very heavy-tailed. Note that to use the simulator, you must first make a copy or export it.
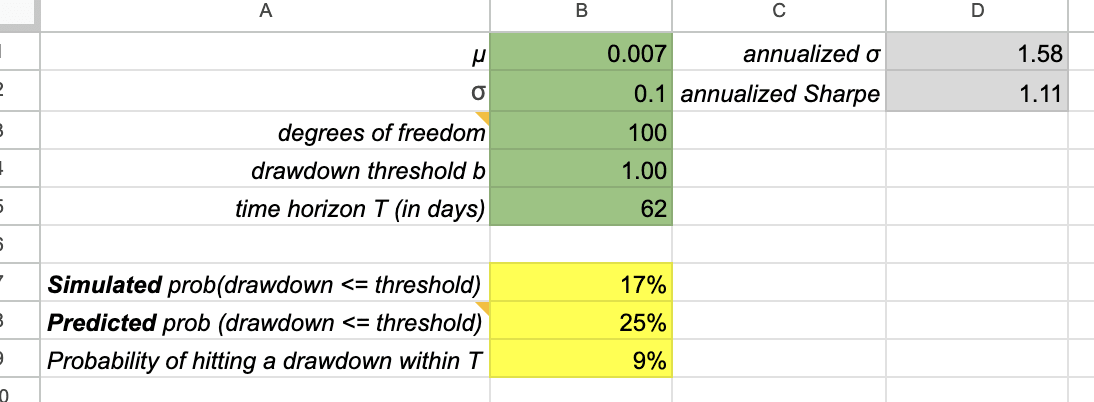
A google spreadsheet can go a long way.
Finally, a couple of statistics help put things in perspective. If the PM is in a $20m drawdown, how long will it take to reach the high-water mark again? The answer is: the normalized drawdown divided by the Sharpe ratio.
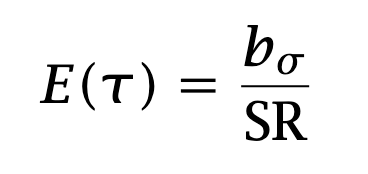
In our example, the normalized drawdown is 0.75 and the Sharpe ratio is 1.25. Thus, 0.75/1.25 = 0.6 years or about 7.2 months. The higher the Sharpe ratio, or the lower the drawdown, the shorter the expected recovery time.
Lastly, what is the average interval between high-water marks? Intuition suggests that this interval is shorter for high-Sharpe strategies. Indeed, the interval is 1/(2xSR2). The duration of drawdowns is highly sensitive to the Sharpe ratio. For an SR of 1.25, the interval is about 0.32 years, that is, slightly less than four months.
What is the observed dispersion of the “interval between high watermarks” distribution? I am guessing would be a very interesting distribution
This assumes a fixed sharpe ratio but it is never constant - especially not when you will have a drawdown ?